Slope of a Line (Coordinate Geometry)


Examples:

Adjust the line below by dragging an orange dot at point A or B. The slope of the line is continuously recalculated. You can also drag the origin point at (0,0).

The slope of a line (also called the gradient of a line) is a number that describes how "steep" it is. In the figure above press 'reset'. Notice that for every increase of one unit to the right along the horizontal x-axis, the line moves down a half unit. It therefore has a slope of -0.5. To get from point A to B along the line, we have to move to the right 30 units and down 15. Again, this is a half unit down for every unit across.

Because the line slopes downwards to the right, it has a negative slope. As x increases, y decreases. If the line sloped upwards to the right, the slope would be a positive number. Adjust the points above to create a positive slope.

Formula for the slope

Given any two points on the line, its slope is given by the formula
where:
Ax  the x coordinate of point A
Ay  the y coordinate of point A
Bx  the x coordinate of point B
By  the y coordinate of point B
It does not matter which point you choose for A or B. So long as they are both on the line somewhere, the formula will produce the correct slope.

Example

In the diagram at the top of the page click on "reset".  Substituting the coordinates for A and B into the formula, we get
Calculator

Finding the slope of a line by inspection

Rather than just plugging numbers into the formula above, we can find the slope by understanding the concept and reasoning it out. Refer to the line on the right, defined by two given points A, B. We can see that the line slopes up and to the right so the slope will be positive.
  1. Calculate dx, the horizontal distance from the left point to the right point. Since B is at (15,5) its x-coordinate is the first number, 15. The x-coordinate of A is 30. So the difference (dx) is 15.
  2. Calculate dy, the amount the line rises or falls as you go to the right. Since B is at (15,5) its y-coordinate is the second number or 5. The y-coordinate of A is 25. So the difference (dy) is +20.
    It is positive because the line goes up as you go to the right. It would have been negative otherwise.
  3. Dividing the rise (dy) by the run (dx):
A way to remember this method is "rise over run". It is the "rise" - the up and down difference between the points, over the "run" - the horizontal run between them. Just remember that rise going downwards is negative.

Slope direction

The slope of a line can positive, negative, zero or undefined.

Positive slope

Here, y increases as x increases, so the line slopes upwards to the right. The slope will be a positive number. The line on the right has a slope of about +0.3, it goes up about 0.3 for every step of 1 along the x-axis.

Negative slope

Here, y decreases as x increases, so the line slopes downwards to the right. The slope will be a negative number. The line on the right has a slope of about -0.3, it goes down about 0.3 for every step of 1 along the x-axis.

Zero slope

Here, y does not change as x increases, so the line in exactly horizontal. The slope of any horizontal line is always zero. The line on the right goes neither up nor down as x increases, so its slope is zero.

Undefined slope

When the line is exactly vertical, it does not have a defined slope. The two x coordinates are the same, so the difference is zero. The slope calculation is then something like
When you divide anything by zero the result has no meaning. The line above is exactly vertical, so it has no defined slope. We say "the slope of the line AB is undefined". A vertical line has an equation of the form x = a, where a is the x-intercept. For more on this see Slope of a vertical line.

Equation of a line

The slope m of a line is one of the elements in the equation of a line when written in the "slope and intercept" form: y = mx+b. The m in the equation is the slope of the line described here. For more on this see:
  • Intercept of a line
  • Equation of a line
  • Equation of a vertical line

Slope as an angle

The slope of the line can also be expressed as an angle, usually in degrees or radians.
In the figure above click on "show angle". By convention the angle is measured from any horizontal line (parallel to x-axis). Lines with a positive slope (up and to the right) have a positive angle, and a negative angle for a negative slope. Change the slope by dragging A or B and see this for yourself.
To convert from slope m to slope angle and back:
angle = arctan(m)
m = tan(angle)
Tan, and its inverse arctan

Solving the interior and exterior angle of a polygon

We will learn how to solve the problems on angle sum property of a polygon having 'n' sides. We know, the sum of 3 angles of a triangle is 180°.

1. Find the sum of all the interior angle of a polygon having 29 sides.
Solution:
We know that sum of all the interior angle in a polygon = (n - 2) × 180°
Here, n = 29
Therefore, the sum of all interior angles = (29 – 2) × 180°
                                                     = 27 × 180°
                                                     = 4860°.

2. If the sum of the measure of the interior angle of polygon is 3240, find the number of sides of the polygon.

Solution:
Let the number of sides of the polygon be n.
The sum of the interior angles = (2n – 4) right angles

But given sum of the interior angles = 3240
Therefore, (2n – 4) × 90° = 3240
           ⇒       2n – 4 = 3240/90
           ⇒       2n – 4 = 36
           ⇒            2n = 36 + 4
           ⇒            2n = 40
           ⇒              n = 40/2
           ⇒              n = 20
Therefore, the number sides of the polygon is 20.

3. Find the sum of interior angles of a decagon.
Solution:
We know, a decagon have 10 sides.
Therefore, n = 10
Sum of interior angles = (2n - 4) × 90°
                              = (2 × 10 - 4) × 90°
                              = (20 - 4) × 90°
                              = 16 × 90°
                              = 1440°
Therefore, the sum of interior angles of a decagon is 1440°.

4. Sum of all interior angles of a polygon is 3060°. How many sides does the polygon have?
Solution:
We know that sum of all the interior angles of a polygon = (n - 2) × 180°
According to the problem, we have
                 (n - 2) ×180 = 3060
               ⇒        (n - 2) = 3060/180         
               ⇒          n – 2 = 17            
               ⇒               n = 17 + 2            
               ⇒               n = 19
Therefore, the polygon have 19 sides.
 Solving Equations on Venn Diagrams

Last June, there were 15 windy days and 20 rainy days, yet 5 days were neither windy nor rainy.’
How can this be, when June only has 30 days? A Venn diagram, and the language of sets, easily sorts this out.

Let W be the set of windy days,
and R be the set of rainy days.
Let E be the set of days in June.
Then W and R; together have size 25, so
the overlap between W and R is 10.; The Venn diagram opposite displays; the whole situation.
The purpose of this module is to introduce language for talking about sets, and some notation for setting out calculations, so that counting problems such as this can be sorted out. The Venn diagram makes the situation easy to visualise.
Content
Describing and naming sets
A set is just a collection of objects, but we need some new words and symbols and diagrams to be able to talk sensibly about sets.
In our ordinary language, we try to make sense of the world we live in by classifying collections of things. English has many words for such collections. For example, we speak of ‘a flock of birds’, ‘a herd of cattle’, ‘a swarm of bees’ and ‘a colony of ants’.
We do a similar thing in mathematics, and classify numbers, geometrical figures and other things into collections that we call sets. The objects in these sets are called the elements of the set.
Describing a set
A set can be described by listing all of its elements. For example,
S = { 1, 3, 5, 7, 9 },

which we read as ‘S is the set whose elements are 1, 3, 5, 7 and 9’. The five elements of the set are separated by commas, and the list is enclosed between curly brackets.

A set can also be described by writing a description of its elements between curly brackets. Thus the set S above can also be written as
S = { odd whole numbers less than 10 },
which we read as ‘S is the set of odd whole numbers less than 10’.
A set must be well defined. This means that our description of the elements of a set is clear and unambiguous. For example, { tall people } is not a set, because people tend to disagree about what ‘tall’ means. An example of a well-defined set is
T = { letters in the English alphabet }.
Equal sets
Two sets are called equal if they have exactly the same elements. Thus following the usual convention that ‘y’ is not a vowel,
{ vowels in the English alphabet } = { a, e, i, o, u }
On the other hand, the sets { 1, 3, 5 } and { 1, 2, 3 } are not equal, because they have different elements. This is written as
{ 1, 3, 5 } ≠ { 1, 2, 3 }.
The order in which the elements are written between the curly brackets does not matter at all. For example,
{ 1, 3, 5, 7, 9 } = { 3, 9, 7, 5, 1 } = { 5, 9, 1, 3, 7 }.
If an element is listed more than once, it is only counted once. For example,
{ a, a, b } = { a, b }.
The set { a, a, b } has only the two elements a and b. The second mention of a is an unnecessary repetition and can be ignored. It is normally considered poor notation to list an element more than once.
The symbols and
The phrases ‘is an element of’ and ‘is not an element of’ occur so often in discussing sets that the special symbols and are used for them. For example, if A = { 3, 4, 5, 6 }, then
3 A (Read this as ‘3 is an element of the set A’.)
8 A (Read this as ‘8 is not an element of the set A’.)
Describing and naming sets
  • A set is a collection of objects, called the elements of the set.
  • A set must be well defined, meaning that its elements can be described and
    listed without ambiguity. For example:
{ 1, 3, 5 } and { letters of the English alphabet }.
  • Two sets are called equal if they have exactly the same elements.
  • The order is irrelevant.
  • Any repetition of an element is ignored.
  • If a is an element of a set S, we write a S.
  • If b is not an element of a set S, we write b S.
EXERCISE 1
a
Specify the set A by listing its elements, where
A = { whole numbers less than 100 divisible by 16 }.

b
Specify the set B by giving a written description of its elements, where
B = { 0, 1, 4, 9, 16, 25 }.

c
Does the following sentence specify a set?
C = { whole numbers close to 50 }.
Finite and infinite sets
All the sets we have seen so far have been finite sets, meaning that we can list all their elements. Here are two more examples:
{ whole numbers between 2000 and 2005 } = { 2001, 2002, 2003, 2004 }
{ whole numbers between 2000 and 3000 } = { 2001, 2002, 2003,…, 2999 }
The three dots ‘…’ in the second example stand for the other 995 numbers in the set. We could have listed them all, but to save space we have used dots instead. This notation can only be used if it is completely clear what it means, as in this situation.
A set can also be infinite − all that matters is that it is well defined. Here are two examples of infinite sets:
{ even whole numbers } = { 0, 2, 4, 6, 8, 10, …}
{ whole numbers greater than 2000 } = { 2001, 2002, 2003, 2004, …}
Both these sets are infinite because no matter how many elements we list, there are always more elements in the set that are not on our list. This time the dots ‘…’ have a slightly different meaning, because they stand for infinitely many elements that we could not possibly list, no matter how long we tried.
The numbers of elements of a set
If S is a finite set, the symbol | S | stands for the number of elements of S. For example:
If S = { 1, 3, 5, 7, 9 }, then | S | = 5.
If A = { 1001, 1002, 1003, …, 3000 }, then | A | = 2000.
If T = { letters in the English alphabet }, then | T | = 26.
The set S = { 5 } is a one-element set because | S | = 1. It is important to distinguish between the number 5 and the set S = { 5 }:
5 S but 5 ≠ S .
The empty set
The symbol represents the empty set, which is the set that has no elements at all. Nothing in the whole universe is an element of :
| | = 0 and x , no matter what x may be.
There is only one empty set, because any two empty sets have exactly the same elements, so they must be equal to one another.
Finite and Infinite sets
  • A set is called finite if we can list all of its elements.
  • An infinite set has the property that no matter how many elements we list,
    there are always more elements in the set that are not on our list.
  • If S is a finite set, the symbol | S | stands for the number of elements of S.
  • The set with no elements is called the empty set, and is written as .
    Thus | | = 0.
  • A one-element set is a set such as S = { 5 } with | S | = 1.
EXERCISE 2
a
Use dots to help list each set, and state whether it is finite or infinite.

i
B = { even numbers between 10 000 and 20 000 }

ii
A = { whole numbers that are multiples of 3 }

b
If the set S in each part is finite, write down | S |.

i
S = { primes }

ii
S = { even primes }

iii
S = { even primes greater than 5 }

iv
S = { whole numbers less than 100 }

c
Let F be the set of fractions in simplest form between 0 and 1 that can be written with a single-digit denominator. Find F and | F |.
Subsets and Venn diagrams
Subsets of a set
Sets of things are often further subdivided. For example, owls are a particular type of bird, so every owl is also a bird. We express this in the language of sets by saying that the set of owls is a subset of the set of birds.
A set S is called a subset of another set T if every element of S is an element of T. This is written as
ST (Read this as ‘S is a subset of T’.)
The new symbol means ‘is a subset of’. Thus { owls } { birds } because every owl is a bird. Similarly,
if A = { 2, 4, 6 } and B = { 0, 1, 2, 3, 4, 5, 6 }, then A B,
because every element of A is an element of B.
The sentence ‘S is not a subset of T’ is written as
S T.
This means that at least one element of S is not an element of T. For example,
{ birds } { flying creatures }
because an ostrich is a bird, but it does not fly. Similarly,
if A = { 0, 1, 2, 3, 4 } and B = { 2, 3, 4, 5, 6 }, then A B,
because 0 A, but 0 B.
The set itself and the empty set are always subsets
Any set S is a subset of itself, because every element of S is an element of S. For example:
{ birds } { birds } and { 1, 2, 3, 4, 5, 6 } = { 1, 2, 3, 4, 5, 6 }.
Furthermore, the empty set is a subset of every set S, because every element of the empty set is an element of S, there being no elements in at all. For example:
{ birds } and { 1, 2, 3, 4, 5, 6 }.
Every element of the empty set is a bird, and every element of the empty set is one of the numbers 1, 2, 3, 4, 5 or 6.
Subsets and the words ‘all’ and ‘if … then’
A statement about subsets can be rewritten as a sentence using the word ‘all’.
For example,
{ owls } { birds }
means
‘All owls are birds.’
{ multiples of 4 } { even numbers }
means
 
‘All multiples of 4 are even.’
{ rectangles } { rhombuses }
means
 
‘Not all rectangles are rhombuses.’
They can also be rewritten using the words ‘if … then’. For example,

{ owls } { birds } means   ‘If a creature is an owl, then it is a bird.’
{ multiples of 4 } { even numbers } means   ‘If a number is a multiple of 4, then it is even’:
{ rectangles } { rhombuses } means   ‘If a figure is a rectangle, then it may not be a square.’
Venn diagrams
Diagrams make mathematics easier because they help us to see the whole situation at a glance. The English mathematician John Venn (1834−1923) began using diagrams to represent sets. His diagrams are now called Venn diagrams.
In most problems involving sets, it is convenient to choose a larger set that contains all of the elements in all of the sets being considered. This larger set is called the universal set, and is usually given the symbol E. In a Venn diagram, the universal set is generally drawn as a large rectangle, and then other sets are represented by circles within this rectangle.
For example, if V = { vowels }, we could choose the universal set as E = { letters of the alphabet } and all the letters of the alphabet would then need to be placed somewhere within the rectangle, as shown below.
In the Venn diagram below, the universal set is E = { 0, 1, 2, 3, 4, 5, 6, 7, 8, 9, 10 }, and each of these numbers has been placed somewhere within the rectangle.
The region inside the circle represents the set A of odd whole numbers between 0 and 10. Thus we place the numbers 1, 3, 5, 7 and 9 inside the circle, because A = { 1, 3, 5, 7, 9 }. Outside the circle we place the other numbers 0, 2, 4, 6, 8 and 10 that are in E but not in A.
The Geometrical Concept of the Derivative

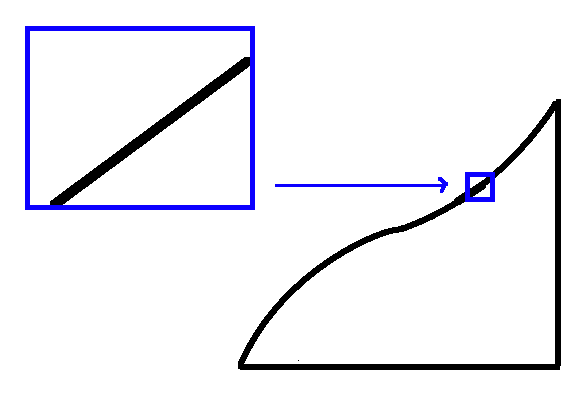
If you have ever found the slope of a line on a graph, that is the derivative. When we are looking at curves instead of linear graphs, it gets difficult to find the slope at every point, because the slope is constantly changing. A way to find the slope is to zoom in on the graph at a point and find the slope at that point.
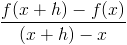
A way to find the slope is using the rise over run method, or the formula for slope:
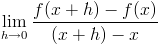
The way to get a better approximated slope, or derivative, is to make the two x values as close as possible. This is a tedious process when you want to find the slope for many points on the graph. This is where differentiation comes in. The definition of a derivative comes from taking the limit of the slope formula as the two points on a function get closer and closer together.
For instance, say we have a point P(x, f(x)) on a curve and we want to find the slope (or derivative) at that point. We can take a point somewhere near to P on the curve, say Q(x+h, f(x+h)), where h is a small value. Now we can plug these values into the slope formula:
Solving for this will get us an approximation of the slope, but it still will not get us an exact value. We want h to be as small as possible so we can get the slope at P, so we let h approach 0.


Limit Definition for the Derivative
This is the slope of the tangent line, or derivative at point P. This gives us the instantaneous rate of change of y with respect to x.
Let's do an example. Consider the function:
Then we substitute x+h in for x
Taking the limit, we would get
Now we simplify
Factor out an h
We can see as h goes to 0, we are left with 6x+2.
This linear expression 6x+2 is the derivative for the function, and we can find the slope of the tangent at any point on the curve by plugging in the x value of the coordinate.
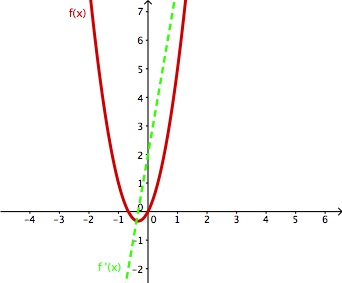
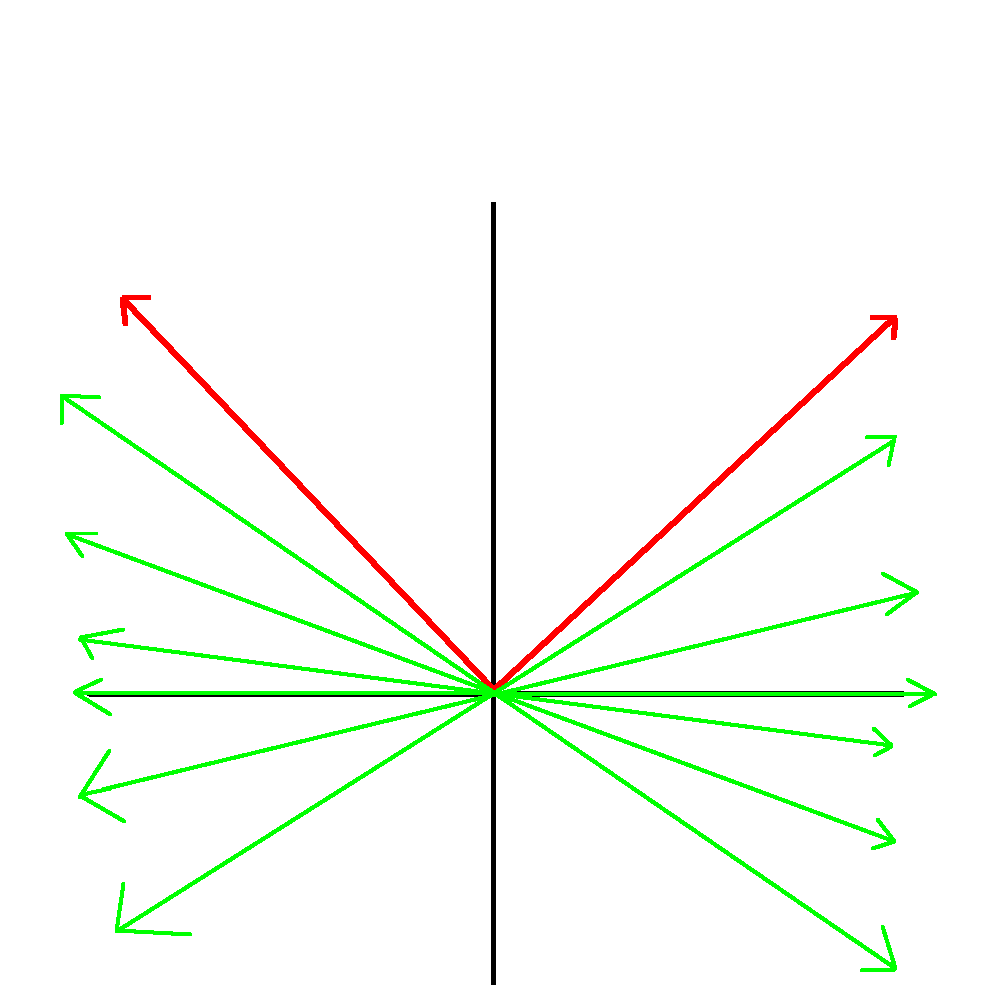
In the graph below, the original function is red and the derivative is green.
Notice that when the slope of the parabola is negative, the function of the derivative is below zero, and when the slope of the parabola is positive, so is the function of the derivative. When the parabola dips and the slope changes from negative to positive, the function of the derivative goes from negative to positive. We can see that at f(-1), f'(-1) = -4, so the slope at -1 is -4. Similarly, at f(0), f'(0) = 2, so the slope at 0 is 2.
Though we have seen the form of the derivative using the limit, it can also be notated as dy/dx, f'(x), or y'


Different notations for the derivative
d/dx means that we are taking the derivative with respect to x.
f'(x) denotes the derivative of f(x), and y' denotes the derivative of y.

Taking the Derivative of Polynomials

Finding the derivative for some functions is harder than others, and can be a tedious process when using the slope formula. Luckily, there is an easier way of obtaining the derivative of polynomials without using limits. Newton and Leibniz discovered an easy way to find the derivative of harder functions that only takes a few steps. Let's look at an example:
The first step to finding the derivative is to take any exponent in the function and bring it down, multiplying it times the coefficient.
We bring the 2 down from the top and multiply it by the 2 in front of the x. Then, we reduce the exponent by 1. The final derivative of that term is 2*(2)x1, or 4x.
For the second term, the exponent is assumed to be 1, so we bring it down and multiply it by the coefficient in front of the x. Then, we reduce the exponent by 1, making it 0. The final derivative of this term is 1*(-5)x0. Note that any number raised to the 0th power is 1, so our simplified answer is 1*(-5)*1, or -5.
The third term is eliminated because it does not have an x, which means it is a constant. The reason for this is because the number 3 can be written as 3x0, and when the 0 comes down the whole term becomes 0. Now we are left with our simplified derivative:
Notice that the derivative is linear and the original function is quadratic. The derivative will always be one degree less than the original function. Here is a general rule for taking the derivative of all terms of a polynomial where c is a constant:


Let's do another graphical example

Differentiable and Non Differentiable

Now, you must be careful when finding the derivative, because not every function has one. Most functions are differentiable, which means that a derivative exists at every point on the function. Some functions, however, are not completely differentiable.
Let's find the derivative of the following function at x = 0.
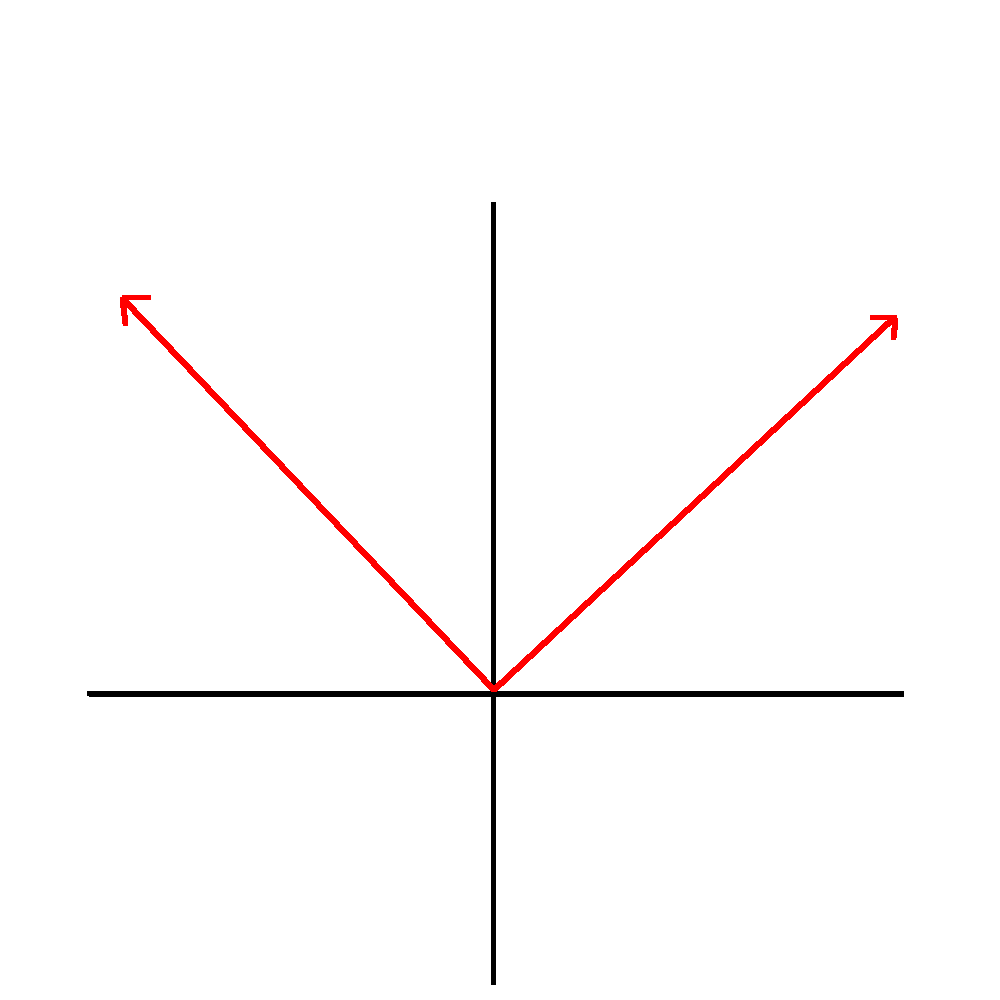
The limit as h approaches 0 from the left is different than when h approaches 0 from the right. This is equivalent to saying the derivative (or slope) on the left is -1, whereas the derivative of the right side is 1. What is the slope where they meet at the origin?
Looking at the graph, we can see that at the origin there is not a definite slope because there are multiple tangents, so there is not a derivative at that point. Therefore, the function does not have a derivative at x=0, so it is differentiable everywhere except for x = 0.
We must note that in order for a function to be differentiable, it must be continuous.

Finding the Tangent Line

Earlier, we found the slope of the tangent line at a point using the limit definition of a derivative. Let's do an example finding the tangent line at a given point using the power rule for polynomials.
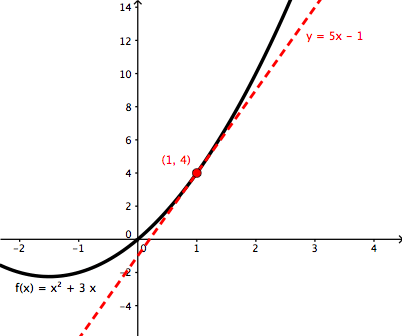
Find the equation to the tangent line to the graph of f(x) = x2 + 3x at (1,4).
We find the derivative using the power rule for differentiation
Plug in our x coordinate into the derivative to get our slope
Now we can use point slope form to find the equation of the tangent line. (1,4) is our point and 5 is our slope

The Physical Concept of the Derivative

Isaac Newton focused on the physical concept of differentiation as it applied to mechanics and instantaneous rate of change. As it relates to mechanics, the rate of change is defined as velocity, or speed, when we are talking about distance over a period of time. Just like the geometrical approach, visualize that you are traveling from point A to point B. We use the formula for the slope to find the average velocity:
Now, if we want to find the instantaneous velocity, we want the change in time to get smaller and smaller. We introduce the concept of a limit as the change in time approaches 0. We end up with
Notice that this is the exact same as the geometric definition of the derivative, but with different variables. The physical definition is based off of the geometric definition, and all of the rules of derivatives apply to both. While you can find velocity by taking the derivative, you can also find the acceleration by taking the second derivative, i.e. taking the derivative of the derivative.
Let's do an example.
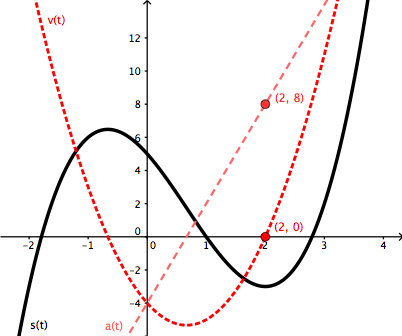
Find the velocity and acceleration of a particle with the given position of s(t) = t3 - 2t2 - 4t + 5 at t = 2 where t is measured in seconds and s is measured in feet.
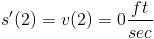
Velocity is found by taking the derivative of the position.
At 2 seconds, the velocity is 0 feet per second.
The acceleration is found by taking the derivative of the velocity function, or the second derivative of the position.
At 2 seconds, the acceleration is 8 feet per second squared.
Let's analyze the graph from a physical perspective. The black curve is the object's position. Notice that when the curve has a hump, the velocity function hits 0. Picture an object going a certain distance in a straight line and then coming back -- the object cannot turn around without the velocity resting at 0. This is the same for the acceleration as it relates to the velocity function. Also, when the acceleration is 0, the graph of the position function looks like a straight line around that point. This is because when the acceleration is 0, the velocity of the object is staying the same, therefore the slope will be constant.